All-in-one
Comprehensive structural analysis for efficient monitoring
My Move IoT Platform

User-centered
Designed to meet and anticipate your needs

Intuitive interface
Clear and simple design for a smooth user experience
24/7 remote asset management
Efficiently oversee your projects with ease, simultaneously monitoring different structures and configuring multi-level severity alarms.
Manage

Dashboard
View all key metrics in one page thanks to an intuitive dashboard for a simpler asset management.
Get instant insights on device activity, threshold events and alarm status changes to better track structural health, ensure project success and improve your decision-making.
Multi-project
Simplify oversight of diverse monitoring projects with a unified platform, perfect for large enterprises working on multiple structures.
Access a high-level management page summarizing all current projects, including alarms and sensor status, for efficient, comprehensive tracking across multiple locations.
Alarms
Ensure safer infrastructure with a user-configurable multi-level alarm system.
Easily discern anomalies through an organized recap page, featuring three severity levels - Alert, Warning, and Critical.
Receive immediate email notifications when thresholds are breached and dive into detailed alarm histories for proactive structural health management.
Comprehensive view of historical data
Delve into historical data, accessing trends and acquisition lists, uncovering hidden patterns for a complete understanding of your structure.
Explore

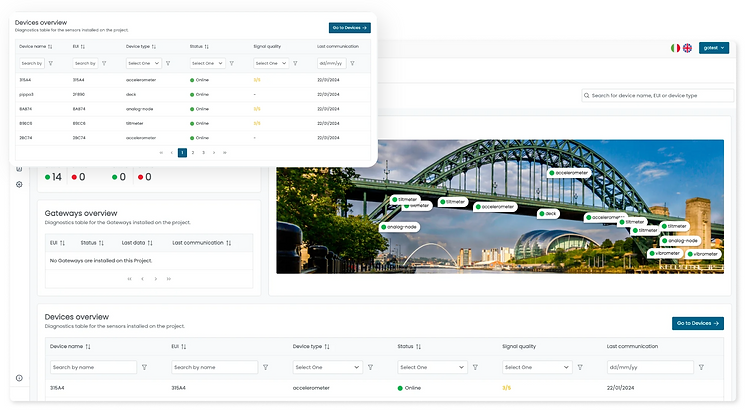
Devices
Benefit from an immediate, comprehensive overview of your sensors, accessing detailed, location-specific insights. You can choose to view them as a list, on a map or placed on real pictures of your structure.
This adaptable visualization ensures precise and efficient managing of your entire system.
Trends
Analyze data through dynamic graphs and charts of monitored parameters for each sensor.
Gaining insights into long-term patterns and behaviours facilitates predictive maintenance and strategic planning for sustained structural health and data-driven decision-making.
Acquisition list
Streamline your data analysis thanks to a list of the acquisitions, detailing every data point collected by selected sensors.
View parameters like date, peak-to-peak measurements, acquisition type, sample rate, and duration, to interpret sensor data with precision and ease for effective structural assessment.

From complex data into actionable insights
Interpret data precisely, comparing graphs and generating customized reports to transform complex datasets into actionable structural health insights.
Analyse

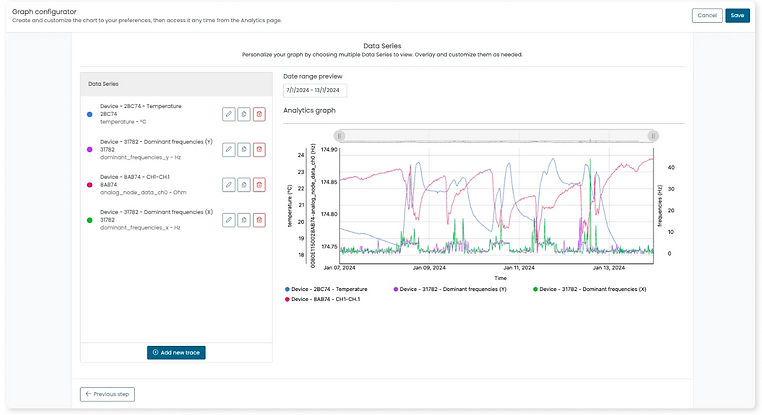
Overlay
Overlay multiple data trends from various sensors, enabling a comprehensive comparison and correlation analysis.
Enhances your understanding of how different structural elements interact and respond to varying conditions, fostering an integrated approach to data interpretation and decision-making.
Customise
Personalise your data visualisation by selecting and arranging a variety of graph types to suit your specific needs.
Focus on the most relevant information, for a deeper, more targeted analysis of your structural health monitoring data, which supports a preventive approach to asset management.
Reports
Customise and download comprehensive PDF reports with ease, choosing from an array of data, graphics, and layouts available on the platform.
Study historical data to track changes, understand trends, and make informed decisions about maintenance and repairs.